Table of Contents
Description
The Signal View UI Services enable the purpose of visualizing signals of the Signal Registry. Signals in the registry are typically provided by other toolboxes or custom filters and services using Signal Provider implementations. For example the Device Toolbox contaings signal provider services that make bus-signals (CAN, FlexRay, etc.) available via the Signal Registry. The creation of a filter or service that provides signals via the Signal Registry is explained in the documentation of ADTF 3.
Configuration
To use the Signal View UI Services you have to include the necessary services into your session. The easiest way to include services into sessions is provided by the CE (configuration editor). The Configuration Editor is shipped with ADTF, please have a look at the guides of ADTF how to use the System Editor. The dependencies, which are defined in the plugindescription, will be configured automatically by adding the service of the Display Toolbox.
You can have more than one instance of the services Qt5 Signal Table View UI Service and Qt5 Signal Table View UI Service. Each instance can be given a custom name using the properties of the service-instance (select relevant service in System Editor and set the title within the Property Editor). The macro THIS_OBJECT_FULL_NAME in the following paragraph resolves to that name. By default a numerical index is attatched to the service name if more than one instance exists.
Layout
Whenever you stop your session containing one of the Signal View UI Services the layout of each service is stored to a separate file and loaded automatically on the next startup. By default the files are stored in the adtfgraphs directory of your session containing the instance-name of the service. This is done using the adtf-macro $(ADTF_GRAPH_DIR)\$(THIS_OBJECT_FULL_NAME) which is the default-value of the property viewconfig_file of the service. You can change that property to another filepath or a macro resolving to one. The specified path will be used to store and load the layout info. Manual loading and storing layout information is not possible yet.
Views
Qt5 Signal Tree View UI Service
- Introduction
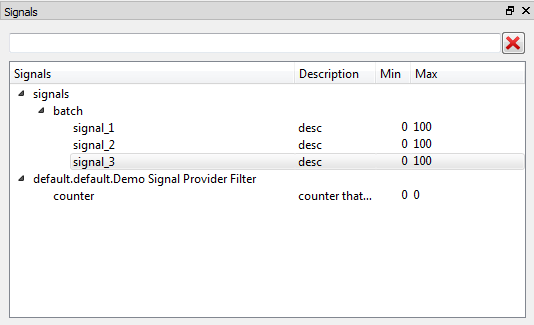
All available signals and their properties are displayed in a tree view. You can use the Filter box on the top of it to quickly find a signal by typing parts of its name. The tree will only show those signals that match your filter string. You can even use wildcards such as "*" and "?". You can also search through the nodes of the tree view. Use slashes "/" to separate nodes and leafs. To display a signal simply drag it from the tree to the display of your liking (Table View, Scope View).
Qt5 Signal Table View UI Service
- Introduction
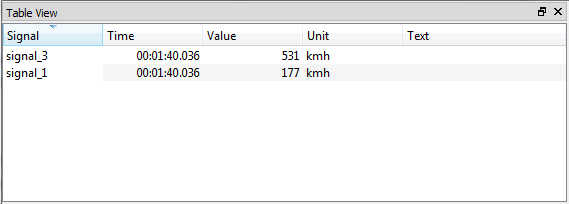
You can add signals from the tree view via drag & drop to the table. By default the complete path of the signal is shown, starting with the name of the Pin.
Qt5 Signal Scope View UI Service
- Introduction
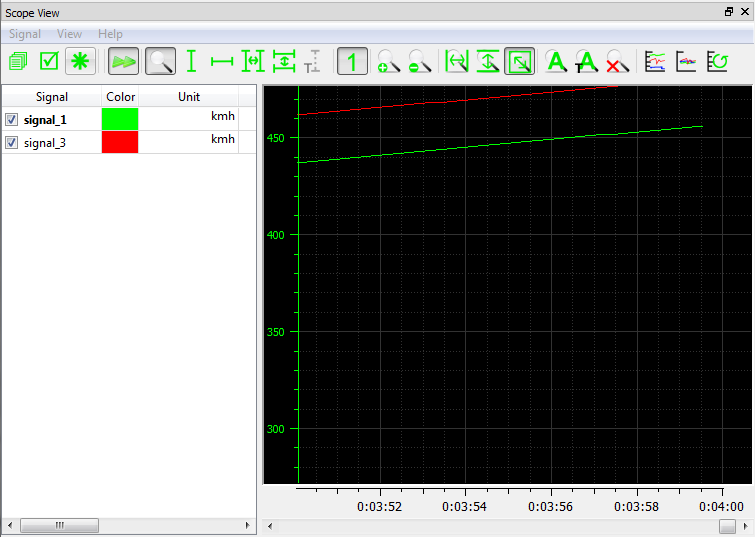
You can add messages/signals from the tree view via drag & drop to the list area of the Scope View. The Scope View can only handle tFloat64 typed values. Signals can be removed using the context menu item Remove. The entry Properties on the context menu or a double click brings up a configuration dialog for the selected signal. There you can change the color, the line style and the plotting of data points. With a double click in the color field you can also change the color of a signal. Please take a look at the online help provided via Help -> Controls. There you will find a complete description on how to control all aspects of the Scope View.
FAQ
- I don't see any signals in the tree view. What could be the problem?
In order to display signals the Signal View requires signal providers. One of these signal providers is the CAN Signal Provider from the Device Toolbox.